What are we concerned about?
People living in neighbourhoods without much greenspace
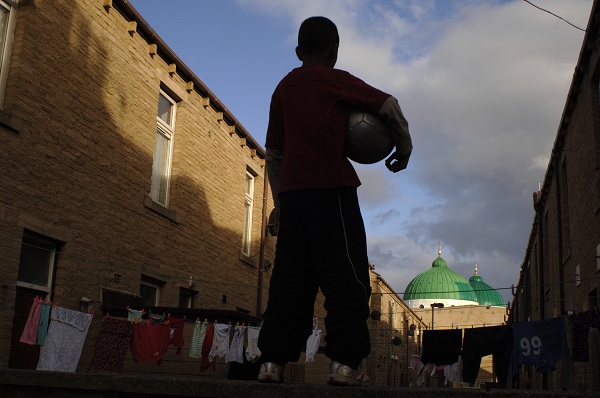
Credit: JRF/Tim Smith
On this page:
- Introduction
- How green infrastructure can regulate the local environment
- Heatwaves and green infrastructure
- Flooding and green infrastructure
Introduction
People living in neighbourhoods with very little greenspace, especially in urban areas, may experience more extreme impacts from events like flooding and heat-waves. 'Green infrastructure' provides a way to improve local neighbourhood environments and better regulate climate change and extreme weather impacts.
The impacts of climate change and extreme weather events can affect anyone, but people living in certain types of neighbourhoods have the potential for more serious harm. Neighbourhoods which are more built up than others are more likely to be associated with higher temperatures, especially during heat waves1. They can also be associated with higher rates of runoff from extreme rainfall, although this is also affected by other factors such as drainage infrastructure and topographic characteristics2.
How green infrastructure can regulate the local environment
‘Green infrastructure’ can be used to increase community resilience to a range of climate-related impacts and provide wider benefits for human health and wellbeing. It can be comprised of natural or semi-natural areas of vegetation, water bodies and other non built-up land and can exist as managed or unmanaged, public or private and small or large zones3,4. Therefore components of green infrastructure can include gardens, green walls and roofs, trees, shrubs and hedges through to parks, allotments, ponds, woodlands, fields, lakes, canals and rivers. Together they provide “an interconnected network of green space that conserves natural ecosystem values and functions and provides associated benefits to human populations”5. Benefits are often thought of as ‘ecosystem services’: including the supply of food and fuel (provisioning services); flood, temperature and erosion control (regulating services); opportunities for recreation and relaxation (social/cultural services) and areas for biodiversity (supporting services)6. The importance of these services for health and wellbeing, sustainability and climate resilience is recognised by central government through its national ecosystem services assessments and associated programme of activities, tools and recommendations7,8.
This section shows how elements of green infrastructure can help to regulate local neighbourhood environments and therefore reduce people’s exposure to climate impacts and related extreme weather. It particularly centres on providing evidence about how urban green spaces (which can include related ‘blue’ space) help to modify high temperatures and the characteristics of surface water runoff.
The regulating services provided by green spaces are particularly valuable for adaptation in towns and cities given that this is where such services are often lacking and where most people live. Although this section centres on one set of functions, it should be remembered that green infrastructure is multi-functional. It provides a role in climate mitigation (carbon storage and sequestration), supports biodiversity and has wider health and wellbeing impacts which influence community resilience 9,10 including:
- Regulating other environmental processes, such as air, water and noise pollution which in turn has financial benefits11.
- Encouraging and providing space for exercise since people are 24% more likely to meet recommended standards of physical exercise if they live within 500m of accessible green space12.
- Helping to support psychological wellbeing, education and child development13.
- Providing spaces for social interaction and improving neighbourhood cohesion14.
The tendency of some neighbourhoods to increase the exposure of people to climate impacts can be compounded by other personal, environmental and social factors which make their residents particularly vulnerable. These include personal factors associated with sensitivity (e.g. due to age or poor health), factors associated with building characteristics (e.g. living in high rise buildings or buildings with basement accommodation) and social factors associated with adaptive capacity, including being on a low income, being socially isolated or being a tenant. People experiencing multiple causes of vulnerability are the most extremely socially vulnerable. See also Which places are disadvantaged?
Heatwaves and green infrastructure
Cities are prone to the 'Urban Heat Island' (UHI) effect, meaning that temperatures in cities are generally higher than in the rural areas which surround them15,16. The extent of these differences varies with weather conditions, season and time of day, often being most marked during the night-time and sometimes not been shown at all. During heatwave events, temperatures in city centres can be particularly high since the weather conditions associated with such events – e.g. low wind speeds and cloud-free conditions – also favour the development of the UHI effect. During the August 2003 heat-wave, a night-time UHI intensity of up to 9 degrees C was recorded in London17. During 2010, air temperature measurements showed that Manchester’s daytime UHI was most commonly around 1 degrees C in both summer and winter, increasing to 1.5 degrees C during summer nights18. Extreme UHI intensities of up to 8 degrees C were recorded during some summer nights with even greater values during winter nights19, when the UHI effect generally provides benefits for people living in urban areas.
The UHI benefits urban residents in winter but can make people more likely to experience heat-related stress and discomfort in summer. Climate projections for the 2050s suggest that average summer night-time temperatures will be around 2-3 degrees C higher than today (based on the central estimate of the medium emissions scenario relative to 1961-90)20. This temperature increase will be felt most acutely in urban areas.
Heat-wave thresholds (Table 1) used to issue warnings and guidance to organisations and the wider public differ across the UK in recognition of the different temperatures which people are used to as a result of where they live in the country. However, they do not account for differences between urban and rural areas, except in London, by virtue of London having its own threshold value.
|
Region |
Day max (°C) |
Night min (°C) |
|
North East England |
28 |
15 |
|
North West England |
30 |
15 |
|
Yorkshire and the Humber |
29 |
15 |
|
West Midlands |
30 |
15 |
|
East Midlands |
30 |
15 |
|
East of England |
30 |
15 |
|
Southeast England |
31 |
16 |
|
London |
32 |
18 |
|
Southwest England |
30 |
15 |
|
Wales |
30 |
15 |
Table 1: Heat-wave thresholds used as part of the Heat-Health Watch system which runs from 1st June to 15h September each year. Temperatures must be forecast to exceed thresholds on at least 2 consecutive days to trigger warnings21.
Green infrastructure has a cooling effect and helps to modify temperatures and the Urban Heat Island effect. For example, urban parks have been shown to be on average 1°C cooler than built-up areas and larger parks have a greater cooling effect22. The cooling effect can occur over considerable distances and be pronounced during the night-time when heatwaves can be particularly problematic. Measurements taken around Kensington Gardens (London) showed temperature reductions of up to 4°C and a cooling effect being felt up to distances of around 400m23. However, interventions on smaller scales and in different forms – such as green roofs and street trees – can also have a local impact and are an important part of green infrastructure planning especially since many urban areas have limited opportunities to establish new green spaces24,25. The most effective measures include trees planted over grass, as long as grass is well watered26. Various evidence reviews and practitioner summaries, are available, for example:
- Academic literature reviews 9, 11,27
- Evidence and policy summaries for particular urban areas10,28,29
- National or generic guidance12,32,33
Green infrastructure also helps to cool temperatures within buildings and reduces the demand for air conditioning, helping to meet wider mitigation policy goals. Neighbourhood green spaces like parks and street trees help to reduce peak summer temperatures over a broad geographical area and therefore also within buildings. Vegetation directly on or near a building also affects internal temperatures including through shading and, in the case of green roofs, through insulation. In summer, this reduces the demand for cooling energy and therefore carbon emissions and lowers the operating costs of any buildings which require artificial cooling11,32. Furthermore, if vegetation is deciduous it allows sunlight through during the winter months when shading is not required.
Green infrastructure may be important for supporting other adaptation measures. For example, since green spaces also help to reduce noise33 and air pollution34,36 they may help to encourage residents to cool bedrooms by leaving windows open during the night during periods of hot weather. (See also Adapting Buildings and Six Steps to Flood Resilience)
The benefits of green infrastructure are particularly helpful where neighbourhood communities are highly vulnerable due to personal, social or other environmental factors, such as building types. Interventions which cool neighbourhoods or provide cool spaces within them may be helpful in a range of cases, for example for:
- People on low incomes living in accommodation requiring adaptation who may not be able to afford the necessary adaptations to cool their homes in summer.
- People in accommodation maintained or managed by others who may have limited capacity to make changes.
- Sensitive people who may be living in accommodation which increases their exposure to high temperatures. Older people who live in multi-occupancy flats may be particularly vulnerable because of a tendency for the flats to overheat and because it may be more difficult for occupants to easily gain access to outdoor spaces which may be cooler37. In addition, restrictions on window openings in care homes or in high-rise flats can make it difficult for occupants to self-moderate temperatures during hot weather.
Flooding and green infrastructure
For those living in urban areas, increased surface sealing by roofs, roads, car parks, walkways and paved over gardens reduces the ability of drainage systems to remove runoff created during intense rainfall events or as a result of flooding.Where water cannot be absorbed into the ground because of built surfaces (or surfaces which are otherwise impermeable such as due to being frozen, very wet or very dry) it forms surface runoff. This runoff is quickly channelled into any drainage systems. If the rates of rainfall and subsequent runoff are higher than the capacity of the drainage system it can cause surface water flooding.
There are many ways that water from any sort of flood event can enter buildings and damage its structure, services and contents39. Although there are technologies available to prevent or reduce the problem, average costs of £4,700 per property40 can be prohibitive, and unaffordable to those on low incomes41 (See also Adapting Buildings).
Green infrastructure has a potential to modify rates of water flow over the ground and also provide areas for water storage during high rainfall or other flood events. For example, the Victoria Business Improvement District in London includes plans for 25ha of green roofs with the potential for handling some 80, 000m3 of runoff in an area known to be susceptible to surface water flooding41. Such initiatives can be expected to have wider community benefits for people working in the vicinity. Runoff reduction has been shown experimentally in Manchester for trees and for greenroofs through partnership between the University of Manchester, Red Rose Forest and Manchester City Council42,43. An analysis of 69 rainfall events in showed that an established green roof in Manchester city centre retained an average of two-thirds of runoff compared to only one third on a neighbouring conventional roof44. Figure 1 quantifies the considerable reduction in runoff expected by trees and especially by grass relative to neighbouring asphalt surfaces45. The reductions in runoff from tree and grass cover Trees in This reduction in runoff reduces the likelihood of drainage systems becoming overwhelmed. Green infrastructure is therefore often part of wider Sustainable Urban Drainage (SUDS) initiatives which may also include other design elements46. Various evidence reviews and practitioner summaries, are available, for example:
- Academic literature reviews 9, 11,47
- Evidence and policy summaries for particular urban areas10,48
- National or generic guidance12,49, 50, 51
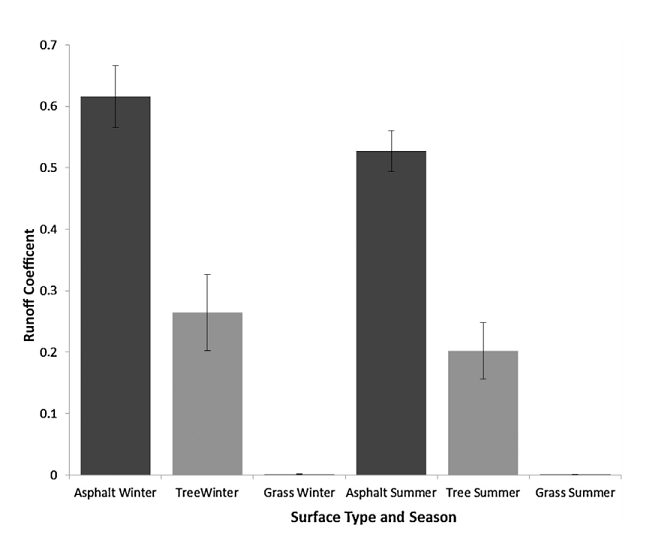
Figure 1: Runoff proportions for different surface covers based on experimental plots in Manchester in 201152
Green infrastructure is particularly helpful where local communities are highly vulnerable due to personal, social or other environmental factors, such as living in buildings which may be more likely to be affected by flooding, such as basement homes. Interventions which reduce the potential for flooding in the wider community may be helpful in a range of cases, for example for:
- People on low incomes living in accommodation requiring adaptation.
- People in accommodation maintained or managed by others who may have limited capacity to make changes.
References
- CCRA (2012) Climate Change Risk Assessment Summary: Built Environment
- Houston, D., Werritty, A., Bassett, D., Geddes, A., Hoolachan, A. & McMillan, M. (2011) “Pluvial (rain-related) flooding in urban areas : the invisible hazard”, Joseph Rowntree Foundation, York
- Jones, S. and Somper, C. (2014) The role of green infrastructure in climate change adaptation in London The Geographical Journal, Vol. 180, No. 2, pp. 191–196
- Tzoulas, K. Korpela, K., Venn, S., Yli-Pelkonen, V., Kazmierczak, A., Niemela, J. and James, P. (2007) Promoting ecosystem and human health in urban areas using Green Infrastructure: A literature review Landscape and Urban Planning 81 167–178
- Benedict, MA, McMahon, ET (2001) page 5 Green Infrastructure: Smart Conservation for the 21st Century. The Conservation Fund. Sprawlwatch Clearinghouse Mono-graph Series
- Millennium Ecosystem Assessment (2005) Ecosystems and Human Well-being: A Framework for Assessment. Island Press
- UKNEA (2011) UK National Ecosystem Assessment: Chapter 10 ‘Urban’
- UK Government (2013) Ecosystem Services guidance
- Tzoulas, K. Korpela, K., Venn, S., Yli-Pelkonen, V., Kazmierczak, A., Niemela, J. and James, P. (2007) Promoting ecosystem and human health in urban areas using Green Infrastructure: A literature review Landscape and Urban Planning 81 167–178
- Jones, S. and Somper, C. (2014) The role of green infrastructure in climate change adaptation in London. The Geographical Journal, Vol. 180, No. 2, pp. 191–196
- Wang, Y., Bakker, F., de Groot, R. Wörtche, H. (2014) Effect of ecosystem services provided by urban green infrastructure on indoor environment: A literature review Building and Environment 77 (2014) 88-100
- Defra (2010) What nature can do for you: A practical introduction to making the most of natural services, assets and resources in policy and decision making
- Shackell, A. and Walter, R. (2012). Greenspace design for health and well-being. Forestry Commission Practice Guide. Forestry Commission, Edinburgh
- Wolch, J. R., Byrne, J., Newell, J. P (2014) Urban green space, public health, and environmental justice: The challenge of making cities ‘just green enough’ Landscape and Urban Planning 125 234-244.
- R. L. Wilby. 2003. Past and projected trends in London’s urban heat island. Weather, 58(7), 2003
- Greater London Authority (2006) London’s Urban Heat Island: A Summary for Decision Makers
- Capon, R. and Oakley, G. (2012) Climate Change Risk Assessment for the Built Environment Sector
- Cheung, Kei Wang (2011) An urban heat island study for building and urban design. PhD thesis, University of Manchester
- Cheung, Kei Wang (2011) An urban heat island study for building and urban design. PhD thesis, University of Manchester
- Capon, R. and Oakley, G. (2012) Climate Change Risk Assessment for the Built Environment Sector
- Met Office National Severe Weather Warning Service
- Bowler, D. E. Buyung-Ali, L., Knight, T. M and Pullin, A. S (2010) Urban greening to cool towns and cities: A systematic review of the empirical evidence Landscape and Urban Planning 97 (2010) 147–155
- Doick, K. J. Peace, A., Hutchings, T. R. (2014) The role of one large greenspace in mitigating London's nocturnal urban heat island Science of the Total Environment 493 662–671
- Speak, A.F., Rothwell, J.J., Lindley, S.J. and Smith, C.L. "Reduction of the urban cooling effects of an intensive green roof due to vegetation damage." Urban Climate 3(2013) : 40-55.
- Skelhorn, C., Lindley, S., Levermore, G. (2014) The impact of vegetation types on air and surface temperatures in a temperate city: A fine scale assessment in Manchester, UK Landscape and Urban Planning 121 (2014) 129–140
- Smith, C (in prep) A review of green infrastructure for urban climate adaptation: Scales of influence
- Smith, C (in prep) A review of green infrastructure for urban climate adaptation: Scales of influence
- The Mersey Forest little book of messages
- Wilby, R.L. and Perry, G.L.W. (2006) Climate change, biodiversity and the urban environment: a critical review based on London, UK Progress in Physical Geography 30: 73-98
- UK Government guidance on ecosystem services
- Town and Country Planning Association (2011) Adaptation by Design
- Skelhorn, C (in prep) Energy demand and greenspace: a practitioner summary
- Dzhambov, A.M. and Dimitrova, D. D. (2014) Urban green spaces' effectiveness as a psychological buffer for the negative health impact of noise pollution: A systematic review Noise and Health 16: 70:157-165
- Bealey, W.J. McDonald, A.G. Nemitz, E. Donovan, R. Dragosits, U.. Duffy, T.R Fowler, D. (2007) Estimating the reduction of urban PM10 concentrations by trees within an environmental information system for planners, Journal of Environmental Management, 85:1, 44-58
- McDonald, A.G.. Bealey, W.J Fowler, D. Dragosits, U. Skiba, U. Smith, R.I. Donovan, R.G. Brett, H.E. Hewitt, C.N. Nemitz, E. (2007) Quantifying the effect of urban tree planting on concentrations and depositions of PM10 in two UK conurbations Atmospheric Environment, 41:38, 8455–8467
- Tiwary, A., Sinnett, D., Peachey, C., Chalabi, Z., Vardoulakis, S. Fletcher, T., Leonardi, G., Grundy, C., Azapagic, A., Hutchings, T.R. (2009) An integrated tool to assess the role of new planting in PM10 capture and the human health benefits: A case study in London Environmental Pollution 157 2645–2653
- Conditioning Demand: Older People, Diversity and Thermal Experience, Briefing Report
- Houston, D., Werritty, A., Bassett, D., Geddes, A., Hoolachan, A. & McMillan, M. (2011) “Pluvial (rain-related) flooding in urban areas : the invisible hazard”, Joseph Rowntree Foundation, York
- JBA/Environment Agency (2012) Evaluation of the Defra Property-level Flood Protection Scheme: 25918
- Bichard, E. and Kazmierczak, A. 2012. Are homeowners willing to adapt to and mitigate the effects of climate change? Climatic Change 112: 633-654
- Natural England, Green Infrastructure Case Study Greening for Growth in Victoria - Creating a vibrant and climate-resilient business area in the heart of London (NE395)
- Speak AF, Rothwell JJ, Lindley SJ, Smith CL. (2013) Rainwater runoff retention on an aged intensive green roof. Sci Total Environ. 2013 Sep 1;461-462:28
- University of Manchester i-trees project
- Speak AF, Rothwell JJ, Lindley SJ, Smith CL. (2013) Rainwater runoff retention on an aged intensive green roof. Sci Total Environ. 2013 Sep 1;461-462:28-38
- Armson, D., Stringer, P., Ennos, A. R. (2013) The effect of street trees and amenity grass on urban surface water runoff in Manchester, UK Urban Forestry & Urban Greening 12 282–286
- HR Wallingford Descriptions of SuDS units
- Smith, C (in prep) A review of green infrastructure for urban climate adaptation: Scales of influence
- Wilby, R.L. and Perry, G.L.W. (2006) Climate change, biodiversity and the urban environment: a critical review based on London, UK Progress in Physical Geography 30: 73-98
- UK Government guidance on ecosystem services
- Town and Country Planning Association (2011) Adaptation by Design
- Chartered Institution of Water and Environmental Management (CIWEM) (2010) Multi-Functional Urban Green Infrastructure: Briefing Report
- (copyright needed if figure used). Armson, D., Stringer, P., Ennos, A. R. (2013) The effect of street trees and amenity grass on urban surface water runoff in Manchester, UK Urban Forestry & Urban Greening 12 282–286

Built by:
![]()
© 2014 - Climate Just
Contact us