Where are the people we are concerned about?
Addressing energy injustice
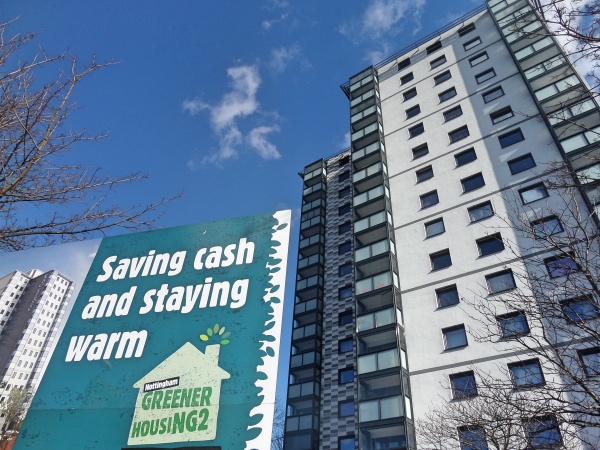
Insulation retrofit to tower block © Climate UK
On this page
- Addressing energy injustice
- Locating fuel poor and energy vulnerable households
- Differences in emissions by location
- Areas benefiting from measures
Addressing energy injustice
- To address energy injustice it can be helpful to consider the location not only of fuel poor households, but also those who are energy vulnerable for other reasons, and the relationship between their location and the delivery of interventions. A question for local action may be to consider where there is a mismatch between community needs and delivery of actions to tackle the problems. Looking at how emissions vary may also be informative in relation to where carbon reduction is most needed and considering how fuel poverty and carbon reduction strategies can come together.
Locating fuel poor and energy vulnerable households
- Fuel poor households are the most likely to be experiencing the triple injustice; fuel poverty is determined by household income and fuel costs, and is higher in rural and off-gas areas. Within England, the West Midlands has the highest proportion of its households living in fuel poverty (around 14%), while the South East has the lowest proportion (around 8%) (Figure 3.1). The region with the greatest proportion of all of England’s fuel poor households is the North West at over 14%. More information can be found in the fuel poverty section on who is fuel poor, and maps of fuel poverty, based on DECC statistics which can also be downloaded from the map tool.
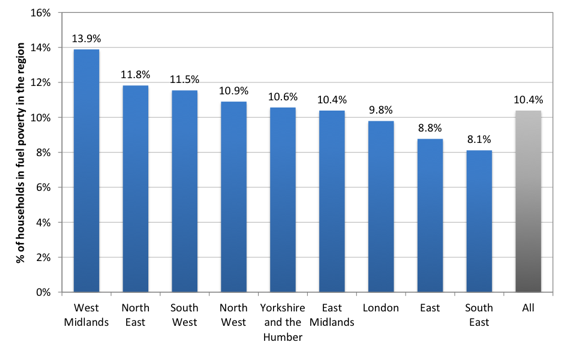
Figure 3.1: Percentage of households in fuel poverty by region, DECC statistics1
- Low income is an important factor in identifying those households which may suffer the triple injustice, and areas of low income can be identified using geographic datasets. The English, Welsh and Scottish indices of multiple deprivation each have an income domain, and using these, neighbourhoods which have high numbers of low income households can be located2. The map tool provides maps of small area estimates of low income households in England using data from the Office for National Statistics.
- Tenure is also an important factor, with households in privately rented accommodation more likely to have homes which are energy inefficient, compared to social rented housing. Census datasets can be used to identify areas with the highest proportions of privately rented accommodation. Local authorities and social landlords may have an understanding of their local areas that is more detailed than the information given by the Census datasets. In particular they will know where social housing is concentrated and whether the social housing has high energy efficiency standards; if it does, those suffering the triple injustice are more likely to be found in areas of low income where there is little social housing.
- Those who heat their homes using electricity have high heating costs and have more policy costs loaded onto their bills. The majority of households that use electricity to heat their homes are located in off-gas areas or urban flats. These kinds of households could benefit from renewable or low carbon heating, such as biomass for off-gas areas and air source heat pumps or district heating for urban flats.
Differences in emissions by location
- There are differences in average household carbon emissions between urban, town and rural areas, with emissions being highest in rural areas and lowest in urban areas. Figure 3.2 shows the difference in average household carbon emissions between urban, town and rural areas. While there is a notable increase in emissions as the level of rurality increases, the difference is modest compared to the effect of income (see section 1). Across all emissions sources shown in the figure, on average rural households have carbon emissions that are one fifth higher than those found in urban areas. When looking at heating fuels only, villages and hamlets have 25% higher emissions from household fuels than urban dwellings. Factors influencing this include a lack of access to gas in many rural areas, leading to greater use of carbon intensive oil, and a greater proportion of rural homes being large, with solid walls, requiring more heating than small, well insulated urban dwellings.
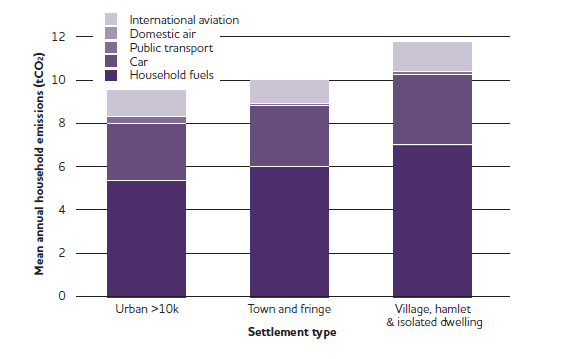
Figure 3.2: Mean annual household CO2 emissions from all sources by settlement type (EFS dataset, England and Wales only)3
- There is little variation in average carbon emissions from heating fuels on a regional basis, although there is more variation when emissions from transport are included. Emissions by region, together with average incomes, are shown in Figure 3.3. London has the lowest average household fuel emissions of any region, due to a higher proportion of smaller dwellings and a high level of access to the gas network. When carbon emissions from transport are also taken into account, there is more variation in emissions across the regions, loosely linked to average income, apart from in London where lower car use and greater availability of public transport bring total emissions down despite high average income (which hides extremes of wealth and poverty). This is the main reason why the higher than average income does not correlate with higher emissions in London as it does in all other regions. Eastern England has the highest overall emissions, as well as the highest emissions from household fuel. Excluding London due to its atypical characteristics, the North East of England has the lowest overall emissions, which is once again in keeping with having the lowest emissions from household fuel.
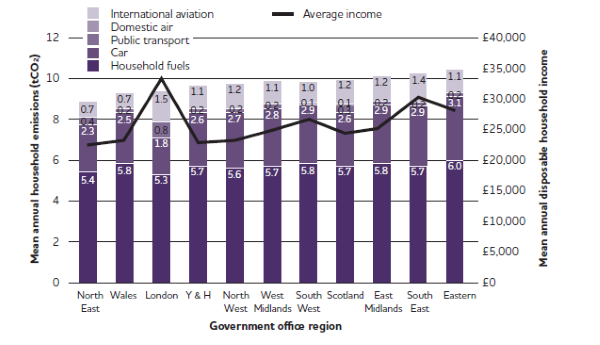
Figure 3.3: Mean annual household CO2 emissions from all sources by region (GB EFS dataset)4
Areas benefiting from measures
- The North West and North East are the regions to benefit most from the ECO to date, relative to population size, while the East and South East have benefited least. Figure 3.4 shows households receiving ECO measures, per 1,000 households, in each English region and the devolved nations. The data covers January 2013 to September 2015. One strand of the ECO aims to reduce household energy bills, while the other two strands aim to reduce carbon emissions (see Box 1.2 for more information), so uptake is influenced by the numbers of households in each region which are eligible for measures under each strand. Information about regional take-up by strand of the ECO is not available, so ECO as a whole is shown in the figure. Other factors also influence uptake of scheme benefits, including existing relationships between energy suppliers, delivery partners and customers, and the number of households which are eligible for the most cost effective measures (not just any of the measures included under the policy), as suppliers aim for the most cost effective measures first.
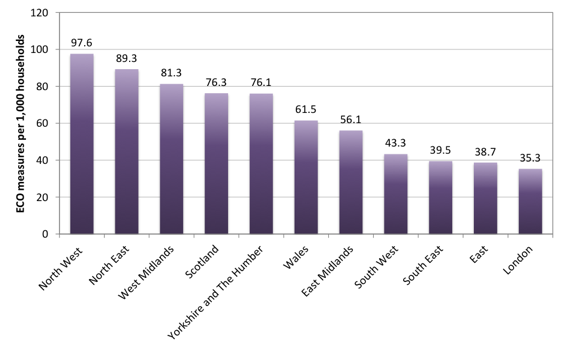
Figure 3.4: Households in receipt of ECO measures, per 1,000 households, by region, Jan 2013-Sept 20155
- Proportionally more households in Scotland and Wales have benefitted than in England as a whole. In Scotland, 76.3 households per thousand received measures during January 2013 to September 2015. For Wales this figure was 61.5, and 59.0 households per thousand received measures in England. Although some individual English regions, such as the North West, North East and the West Midlands are doing better than Scotland, households in England as a whole benefitted less. This can be attributed to additional support available for energy efficiency improvements in Scotland. For example, the Home Energy Efficiency Programmes for Scotland (HEEPS), which can be used to match-fund additional ECO funding. In Wales similar schemes exist allowing leverage of ECO funding, for instance the Welsh Government Warm Homes Nest and Arbed schemes.
- Urban areas have benefited more than rural areas in the first year of the ECO, across Britain. The available evidence here, shown in Figure 3.5, only covers the first year of the ECO7 (2013). Anecdotally it is harder to get measures to rural areas due to lower housing density, as well as rural housing often being off-gas and having solid walls, making the delivery of measures to reduce emissions more costly. Thus if more recent data were available it is likely that urban areas would still be favoured. Rural properties comprised only 7.5% of all properties that received measures under ECO over 2013. The figures in the graph have been weighted to allow for the fact that more people live in urban areas8. Anecdotally, it is not dense urban areas that benefit most; as can be seen in the previous figure (3.4), a relatively low number of households in London have benefited. Rather, it appears that suburban areas do best.
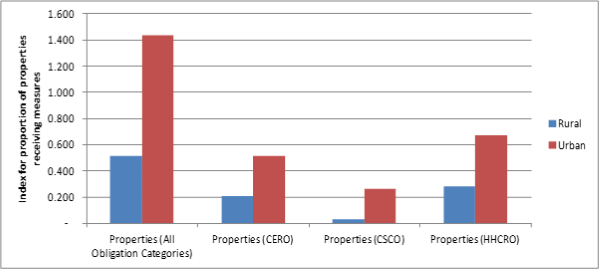
Figure 3.5: Comparison of properties with measures in rural and urban areas, by obligation category 20139
- When the proportion of ECO measures installed is compared by rurality within the different devolved nations, urban areas again do better. It should be noted that, again, the data here only covers the first year of the ECO. Figure 3.6 shows that rural England is currently receiving the lowest proportion of measures, followed by rural Scotland and then rural Wales. When looking at urban areas, Wales and Scotland are broadly on a par, while England has a lower number of urban area properties that have benefited. A major reason for greater success in the devolved nations is that both Wales and Scotland have their own, additional, tax-funded fuel poverty programmes as well are used to leverage ECO funded.
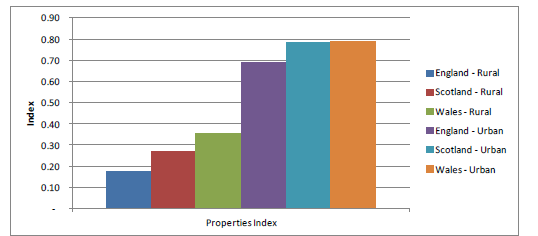
Figure 3.6: Comparison of properties with measures, by country and rurality10
|
Reference box for Figure 3.6 The index on the vertical axis is created by dividing the number of properties receiving measures in each type of area by the total number of properties in the area, and then multiplying by 100. |
References
- DECC (2014) Fuel poverty detailed tables 2015. Detailed tables under the low income high costs indicator.
- England (2015); Scotland (2012); Wales (2014)
- Preston, I., White, V., Thumim, J., Bridgeman, T., and Brand, C (2013) Distribution of Carbon Emissions in the UK: Implications for Domestic Energy Policy, p.42 The urban/rural classification system used here is based on the ONS Rural and Urban Classification of Output Areas (ONS, 2003) for England and Wales. A different classification system exists in Scotland. As it is not possible to merge the two, analysis is limited to the England and Wales subset of the EFS dataset (22,017,000 weighted count).
- Preston, I., White, V., Thumim, J., Bridgeman, T., and Brand, C (2013) Distribution of Carbon Emissions in the UK: Implications for Domestic Energy Policy, p.43
- DECC (2016) Household Energy Efficiency National Statistics, headline release February 2016 Table 2.2.3
- DECC (2016) Household Energy Efficiency National Statistics, headline release February 2016 Table 2.2.3
- Centre for Sustainable Energy (2014) The ECO: an evaluation of year 1
- By dividing the number of properties receiving measures in each type of area by the total number of properties in each type of area; as this resulted in a very small number it was multiplied by 100 to create an index.
- Centre for Sustainable Energy (2014) The ECO: an evaluation of year 1, p.80
- Centre for Sustainable Energy (2014) The ECO: an evaluation of year 1, p.80 The index on the vertical axis is created by dividing the number of properties receiving measures in each type of area by the total number of properties in the area, and then multiplying by 100.

Built by:
![]()
© 2014 - Climate Just
Contact us